Self Help Knowledge Base
Sales Dashboard
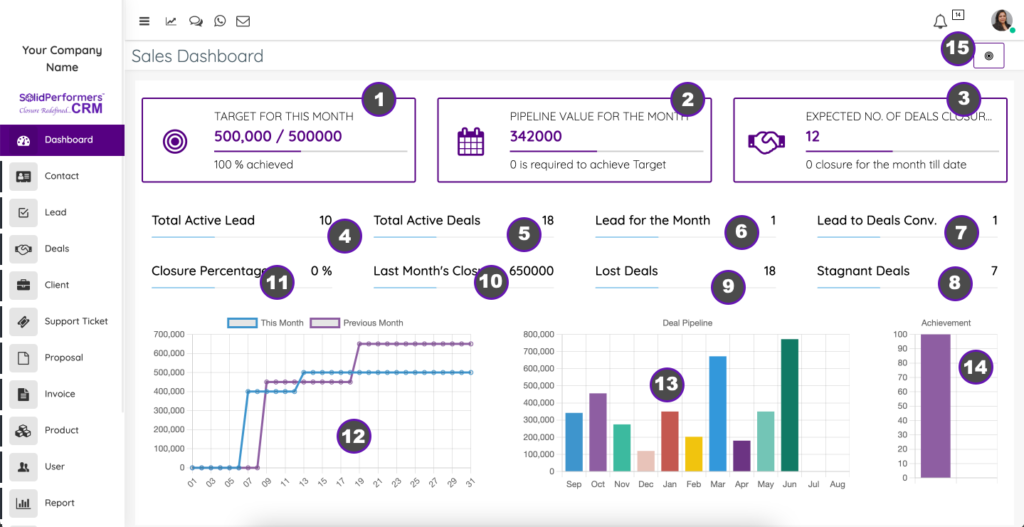
(Path: https://account.solidperformers.com/sales_dashboard )
- The target amount and the achieved target
- Expected pipeline value for this month. This data will be fetched from the deal module based on your expected closure value, probability of closure and expected closure date.
- The total number of deals in pipeline for this month’s closure
- Total active leads which were received less than 60 days and still active
- Total active deals which were received less than 60 days and still active
- New leads received / added in the current ongoing month
- New deals added in the current ongoing month
- The leads which are not moving to the next stage for over 90 days
- The deals which are lost in this month
- The closure value of last month
- The total closure vs the total leads received this month
- Graphical representation of the payment received in this month vs last month. The payment needs to be added under the Income module.
- Expected pipeline value for the next 12 months. This data will be fetched from the deal module based on your expected closure value, probability of closure and expected closure date.
- Target vs Achieved Value in percentage
- You can set the target for your users from here